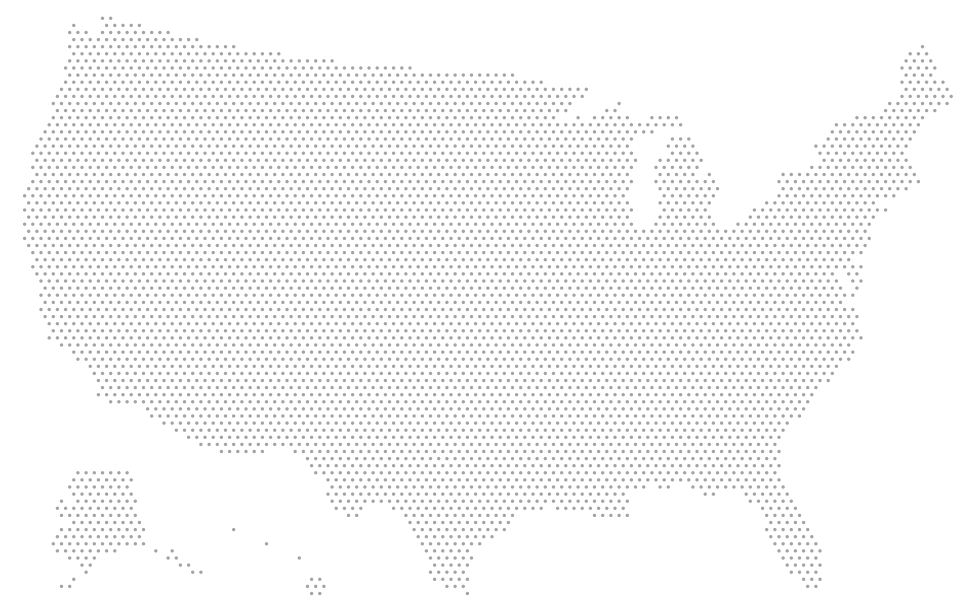
Original data · model estimates
Snowbird Car Shipping Price Report, 2026‑27 season
In the October 2026 HaulFare price model, shipping an open-carrier sedan on 40 snowbird corridors is estimated at $1,305 on average southbound in October 2026 and $1,330 northbound in April 2027. Shipping with the seasonal flow costs an estimated 24% more than the same trip the other way. November is the cheapest peak month heading south, March heading north.
Updated October 2026
License: CC BY 4.0 · Cite as “HaulFare Snowbird Car Shipping Price Report, 2026-27 season (October 2026 price edition)”
The season at a glance
Average estimates across the 40 corridors, open-carrier running sedan, hub to hub.
Model estimates, not booked prices. Every figure on this page comes from the published HaulFare price model for an open-carrier, running sedan, main carrier hub to main carrier hub, at October 2026 model inputs. HaulFare is a price guide, not a broker or carrier: the licensed transport partner confirms the actual price, which can be higher or lower.
- $1,305
average southbound estimate, October 2026
- $1,330
average northbound estimate, April 2027
- +24%
estimated premium for shipping with the seasonal flow
- 40
corridors from the Northeast and Midwest to Florida, Arizona, Texas and South Carolina
Key findings
What the October 2026 price model shows for the 2026-27 season.
The busy direction costs more.
In October 2026 the 40 corridors average an estimated $1,305 southbound versus $1,055 for the same corridors run north, a gap of $250 (24%). In April 2027 the gap flips: $1,330 northbound versus $1,075 southbound.
November is the cheapest southbound peak month and March the cheapest northbound on all 40 corridors.
The most expensive month in the report is May 2027 heading north, at an estimated $1,370 on average.
Moving a pickup one month outside the peak lowers the estimate more than switching months within it.
Heading south, a September pickup is estimated 11% below October and a January pickup 16% below December. Heading north, February is estimated 17% below March and June 10% below May.
Distance sets the base.
The least expensive corridor in October is Ohio to South Carolina ($715–$890, 503 road miles); the most expensive is Massachusetts to Arizona ($1,655–$2,060, 2,708 miles). Longer trips cost more in total but less per mile.
Estimated prices by corridor and month
Open-carrier sedan, estimated range for a pickup in each month: southbound in the fall of 2026 and northbound in the spring of 2027, the busy direction in both cases. The lowest of the three months in each direction is in bold. Where a corridor has its own route page, the state name links to it.
To Florida (priced to Orlando)
| Home state | Road miles | Southbound 2026 (est.) | Northbound 2027 (est.) | ||||
|---|---|---|---|---|---|---|---|
| Oct | Nov | Dec | Mar | Apr | May | ||
| New YorkNew York City · return trip | 1,108 | $1,095–$1,360 | $1,070–$1,335 | $1,085–$1,350 | $1,085–$1,350 | $1,115–$1,390 | $1,150–$1,430 |
| New JerseyNewark | 1,105 | $1,095–$1,360 | $1,070–$1,335 | $1,080–$1,345 | $1,080–$1,345 | $1,115–$1,390 | $1,150–$1,430 |
| PennsylvaniaPhiladelphia | 1,019 | $1,040–$1,295 | $1,020–$1,270 | $1,030–$1,280 | $1,030–$1,280 | $1,060–$1,320 | $1,095–$1,360 |
| MassachusettsBoston | 1,317 | $1,195–$1,490 | $1,175–$1,460 | $1,185–$1,475 | $1,185–$1,475 | $1,220–$1,520 | $1,255–$1,560 |
| ConnecticutHartford | 1,222 | $1,155–$1,440 | $1,130–$1,405 | $1,145–$1,420 | $1,145–$1,420 | $1,180–$1,465 | $1,210–$1,505 |
| OhioColumbus | 937 | $1,000–$1,245 | $975–$1,215 | $990–$1,230 | $990–$1,230 | $1,015–$1,265 | $1,050–$1,305 |
| MichiganDetroit | 1,130 | $1,105–$1,380 | $1,085–$1,350 | $1,095–$1,360 | $1,095–$1,360 | $1,130–$1,405 | $1,160–$1,445 |
| IllinoisChicago | 1,164 | $1,125–$1,400 | $1,105–$1,370 | $1,115–$1,390 | $1,115–$1,390 | $1,150–$1,430 | $1,185–$1,475 |
| MinnesotaMinneapolis | 1,545 | $1,280–$1,590 | $1,255–$1,560 | $1,270–$1,580 | $1,270–$1,580 | $1,305–$1,625 | $1,345–$1,675 |
| WisconsinMilwaukee | 1,258 | $1,170–$1,455 | $1,150–$1,430 | $1,160–$1,445 | $1,160–$1,445 | $1,195–$1,485 | $1,230–$1,530 |
To Arizona (priced to Phoenix)
| Home state | Road miles | Southbound 2026 (est.) | Northbound 2027 (est.) | ||||
|---|---|---|---|---|---|---|---|
| Oct | Nov | Dec | Mar | Apr | May | ||
| New YorkNew York City | 2,524 | $1,585–$1,970 | $1,555–$1,930 | $1,570–$1,955 | $1,570–$1,955 | $1,615–$2,010 | $1,665–$2,070 |
| New JerseyNewark | 2,515 | $1,580–$1,965 | $1,550–$1,925 | $1,565–$1,950 | $1,565–$1,950 | $1,610–$2,005 | $1,660–$2,065 |
| PennsylvaniaPhiladelphia | 2,451 | $1,560–$1,945 | $1,530–$1,905 | $1,550–$1,925 | $1,550–$1,925 | $1,595–$1,980 | $1,645–$2,045 |
| MassachusettsBoston | 2,708 | $1,655–$2,060 | $1,625–$2,020 | $1,645–$2,045 | $1,645–$2,045 | $1,690–$2,105 | $1,740–$2,165 |
| ConnecticutHartford | 2,608 | $1,620–$2,015 | $1,585–$1,970 | $1,600–$1,995 | $1,600–$1,995 | $1,650–$2,055 | $1,700–$2,115 |
| OhioColumbus | 1,963 | $1,420–$1,765 | $1,390–$1,730 | $1,405–$1,745 | $1,405–$1,745 | $1,450–$1,805 | $1,490–$1,855 |
| MichiganDetroit | 1,991 | $1,425–$1,775 | $1,395–$1,735 | $1,415–$1,760 | $1,415–$1,760 | $1,455–$1,810 | $1,500–$1,865 |
| IllinoisChicago | 1,713 | $1,345–$1,675 | $1,320–$1,640 | $1,330–$1,660 | $1,330–$1,660 | $1,375–$1,710 | $1,415–$1,760 |
| MinnesotaMinneapolis | 1,508 | $1,265–$1,575 | $1,240–$1,540 | $1,250–$1,555 | $1,250–$1,555 | $1,285–$1,600 | $1,330–$1,650 |
| WisconsinMilwaukee | 1,725 | $1,350–$1,680 | $1,325–$1,645 | $1,335–$1,665 | $1,335–$1,665 | $1,375–$1,715 | $1,420–$1,765 |
To Texas (priced to Dallas)
| Home state | Road miles | Southbound 2026 (est.) | Northbound 2027 (est.) | ||||
|---|---|---|---|---|---|---|---|
| Oct | Nov | Dec | Mar | Apr | May | ||
| New YorkNew York City · return trip | 1,617 | $1,310–$1,630 | $1,285–$1,595 | $1,295–$1,615 | $1,295–$1,615 | $1,335–$1,665 | $1,375–$1,715 |
| New JerseyNewark | 1,608 | $1,305–$1,625 | $1,280–$1,590 | $1,290–$1,605 | $1,290–$1,605 | $1,330–$1,660 | $1,375–$1,710 |
| PennsylvaniaPhiladelphia | 1,531 | $1,275–$1,585 | $1,245–$1,550 | $1,260–$1,570 | $1,260–$1,570 | $1,300–$1,620 | $1,335–$1,665 |
| MassachusettsBoston | 1,828 | $1,380–$1,720 | $1,355–$1,685 | $1,370–$1,700 | $1,370–$1,700 | $1,415–$1,760 | $1,455–$1,810 |
| ConnecticutHartford | 1,720 | $1,350–$1,680 | $1,325–$1,645 | $1,335–$1,665 | $1,335–$1,665 | $1,375–$1,715 | $1,420–$1,765 |
| OhioColumbus | 1,077 | $1,075–$1,340 | $1,055–$1,310 | $1,065–$1,325 | $1,065–$1,325 | $1,100–$1,365 | $1,130–$1,405 |
| MichiganDetroit | 1,179 | $1,135–$1,410 | $1,110–$1,385 | $1,120–$1,395 | $1,120–$1,395 | $1,155–$1,440 | $1,190–$1,480 |
| IllinoisChicago | 950 | $1,005–$1,250 | $985–$1,225 | $995–$1,240 | $995–$1,240 | $1,025–$1,275 | $1,055–$1,310 |
| MinnesotaMinneapolis | 1,019 | $1,040–$1,295 | $1,020–$1,270 | $1,030–$1,280 | $1,030–$1,280 | $1,060–$1,320 | $1,095–$1,360 |
| WisconsinMilwaukee | 1,012 | $1,035–$1,290 | $1,015–$1,265 | $1,025–$1,275 | $1,025–$1,275 | $1,060–$1,315 | $1,090–$1,355 |
To South Carolina (priced to Columbia)
| Home state | Road miles | Southbound 2026 (est.) | Northbound 2027 (est.) | ||||
|---|---|---|---|---|---|---|---|
| Oct | Nov | Dec | Mar | Apr | May | ||
| New YorkNew York City | 711 | $865–$1,075 | $845–$1,055 | $855–$1,065 | $855–$1,065 | $880–$1,100 | $910–$1,130 |
| New JerseyNewark | 706 | $860–$1,070 | $845–$1,055 | $850–$1,060 | $850–$1,060 | $880–$1,090 | $905–$1,125 |
| PennsylvaniaPhiladelphia | 617 | $810–$1,010 | $790–$985 | $800–$995 | $800–$995 | $825–$1,025 | $850–$1,060 |
| MassachusettsBoston | 933 | $995–$1,240 | $975–$1,215 | $985–$1,225 | $985–$1,225 | $1,015–$1,265 | $1,045–$1,300 |
| ConnecticutHartford | 829 | $935–$1,165 | $920–$1,140 | $925–$1,155 | $925–$1,155 | $955–$1,185 | $980–$1,220 |
| OhioColumbus | 503 | $715–$890 | $700–$875 | $710–$885 | $710–$885 | $730–$905 | $750–$935 |
| MichiganDetroit | 691 | $855–$1,065 | $835–$1,040 | $845–$1,055 | $845–$1,055 | $870–$1,080 | $895–$1,115 |
| IllinoisChicago | 769 | $895–$1,115 | $880–$1,090 | $885–$1,105 | $885–$1,105 | $915–$1,135 | $940–$1,170 |
| MinnesotaMinneapolis | 1,178 | $1,135–$1,410 | $1,110–$1,385 | $1,120–$1,395 | $1,120–$1,395 | $1,155–$1,440 | $1,190–$1,480 |
| WisconsinMilwaukee | 857 | $955–$1,185 | $935–$1,165 | $945–$1,175 | $945–$1,175 | $970–$1,210 | $1,000–$1,245 |
With the flow versus against it
Every corridor in this report is estimated to cost more in its busy direction. The table compares the average estimate for the with-flow direction with the same 40 corridors run the other way in the same month. On New York to Florida, for example, a October pickup is estimated at $1,215 heading south and $985 heading north (midpoints).
| Pickup month | Busy direction | With the flow (avg est.) | Against the flow (avg est.) | Difference |
|---|---|---|---|---|
| October 2026 | Southbound | $1,305 | $1,055 | +$250 (+23.7%) |
| November 2026 | Southbound | $1,280 | $1,035 | +$245 (+23.7%) |
| December 2026 | Southbound | $1,295 | $1,045 | +$250 (+23.9%) |
| March 2027 | Northbound | $1,295 | $1,045 | +$250 (+23.9%) |
| April 2027 | Northbound | $1,330 | $1,075 | +$255 (+23.7%) |
| May 2027 | Northbound | $1,370 | $1,110 | +$260 (+23.4%) |
Best months to ship each way
Average estimated midpoint across the 40 corridors for every month of the season, both directions. “Peak” marks the busy direction (+15% in the model); “Backhaul” marks the quiet direction, when carriers look for loads (−7%).
- Heading south: November is the lowest-priced peak month. The lowest-priced month from September to January is January, estimated 17% below October.
- Heading north: March is the lowest-priced peak month. The lowest-priced month from February to June is February, estimated 21% below May.
- Outside both peaks the model prices the two directions the same, so the only seasonal effect left is the national month index.
| Month | Southbound (avg est.) | Northbound (avg est.) |
|---|---|---|
| September 2026 | $1,160 | $1,160 |
| October 2026 | $1,305Peak | $1,055Backhaul |
| November 2026 | $1,280Peak | $1,035Backhaul |
| December 2026 | $1,295Peak | $1,045Backhaul |
| January 2027 | $1,090 | $1,090 |
| February 2027 | $1,080 | $1,080 |
| March 2027 | $1,045Backhaul | $1,295Peak |
| April 2027 | $1,075Backhaul | $1,330Peak |
| May 2027 | $1,110Backhaul | $1,370Peak |
| June 2027 | $1,235 | $1,235 |
When to book
HaulFare booking guidance, not an industry rule: request a with-flow peak pickup 4 to 6 weeks ahead, counted back from the first of the pickup month. Published snowbird guides from auto transport companies suggest 3 to 6 weeks for an October or November pickup. Booking early does not lock a price; it gives the broker more time to find a truck already running your corridor. A request made later can still be posted to carriers, but it may take longer to match.
To price your own dates, ZIP codes and vehicle, use the snowbird route planner or read more about snowbird car shipping.
| Pickup month | Suggested request window |
|---|---|
| December 2026Southbound | Oct 20, 2026 to Nov 3, 2026Open now |
| March 2027Northbound | Jan 18, 2027 to Feb 1, 2027 |
| April 2027Northbound | Feb 18, 2027 to Mar 4, 2027 |
| May 2027Northbound | Mar 20, 2027 to Apr 3, 2027 |
| October 2026Southbound | Aug 20, 2026 to Sep 3, 2026Closed |
| November 2026Southbound | Sep 20, 2026 to Oct 4, 2026Closed |
Status as of Oct 23, 2026 (UTC). Windows whose last day has passed are marked closed and listed last.
Methodology
How the corridors, distances and prices are built, and what the figures leave out.
Corridors. 40 corridors from New York, New Jersey, Pennsylvania, Massachusetts, Connecticut, Ohio, Michigan, Illinois, Minnesota and Wisconsin to Florida, Arizona, Texas and South Carolina, the states the HaulFare price model flags as snowbird destinations. Each is priced from the home state's main carrier hub to the destination's (for example New York City to Orlando, or Minneapolis to Phoenix). Road miles are the straight-line distance between the two hub cities, from U.S. Census Bureau Gazetteer coordinates, multiplied by a road-circuity factor (1.18 on long interstate trips). The same hubs and distances feed the state-pair route pages and the Car Shipping Cost Index, so the numbers agree across the site.
Price model. HaulFare price model 2026.09-seed: a per-mile rate curve for an open-carrier, running sedan, calibrated in September 2026 against published 2026 rate cards and cost studies; a national month index; the snowbird direction multiplier described below; and a pass-through of 10% of the change in the U.S. EIA weekly on-highway diesel price against a $5.60 baseline. The diesel input for this edition is $6.38 a gallon, which adds about 1.4% to every estimate. Each range runs from 10% below to 12% above the midpoint, rounded to $5. Averages are simple means of the corridor midpoints, rounded to $5.
How the snowbird multiplier works. When the home state is a northern snowbird origin and the destination is a snowbird destination, the model adds 15% to trips that run with the seasonal flow (southbound October to December, northbound March to May) and takes 7% off trips that run against it in those months. Published snowbird guides from auto transport companies put the southbound rush in October and November and the northbound rush in March and April, with peak rates 15 to 25% higher or $150 to $300 above off-season rates (sources below). The model uses the low end of that premium and runs each window one month longer, through December southbound and May northbound, to cover shoulder weeks. Because the same multipliers apply to every corridor, the percentage differences are nearly identical from corridor to corridor; the dollar differences grow with distance.
What the figures are not. They are not averages of booked shipments or of quotes, and they do not include door-to-door surcharges for rural addresses, inoperable vehicles or expedited pickup. A small SUV adds about 8% in the model, a full-size SUV about 20% and enclosed transport about 42%. Figures are recomputed when the monthly price edition rolls on the 1st, so they can move with diesel prices; the CSV file name carries the season and the edition month.
Sources
- Snowbird Car Shipping: When to Book, What It Costs, and How to Time It Right, published August 8, 2026, jackcooper.com
- Snowbird Car Shipping to Florida (2026 Guide), published August 24, 2026, monarchtg.com
- U.S. EIA Gasoline and Diesel Fuel Update (weekly on-highway diesel), eia.gov
- U.S. Census Bureau Gazetteer Files, census.gov
- Creative Commons Attribution 4.0 International license, creativecommons.org
Cite this report
Free to reuse under CC BY 4.0. Cite as “HaulFare Snowbird Car Shipping Price Report, 2026-27 season (October 2026 price edition)” and link to this page. Please call the figures model estimates. For raw data or a cut for one metro, email press@haulfare.com.
Embed this table
Paste this HTML into an article or a CMS HTML block to show the corridor prices on your own page. It uses plain inline styles and no scripts, and its credit line links back here under the CC BY 4.0 license.
First 25 of 40 corridors, 13.1 KB of HTML, with a link to the CSV for the rest.
Code selected. Press Ctrl+C (Cmd+C on a Mac) to copy it.
About the report
How much does it cost to ship a car to Florida for the winter?
In the October 2026 HaulFare price model, an open-carrier sedan going south in October 2026 is estimated at $1,095–$1,360 from New York to Florida and $1,125–$1,400 from Illinois to Florida, hub to hub. The trip home in April 2027 is estimated at $1,115–$1,390 and $1,150–$1,430. These are model estimates; the licensed transport partner confirms the actual price.
Why does shipping a car south cost more in the fall?
Because seasonal residents tend to travel the same way at the same time, so car carriers fill quickly heading south in the fall and head back north looking for loads; in spring the pattern flips. The model treats October to December as the southbound peak and March to May as the northbound peak. The HaulFare model adds 15% to a trip running with that flow and takes 7% off a trip running against it, so the busy direction is estimated about 24% dearer than the same corridor run the other way in the same month.
What is the cheapest month to ship a car for the winter?
Inside the peak, November is the lowest-priced southbound month and March the lowest-priced northbound month on all 40 corridors in this report. Outside it, a September pickup heading south is estimated about 11% below October, and a February pickup heading north about 17% below March, on average across the corridors.
Are these prices from real shipments?
No. Every figure is a model estimate from the published HaulFare price model (version 2026.09-seed), calibrated to 2026 rate cards and cost studies. None is an average of booked shipments or of quotes, and every row in the CSV is labelled "model". Real prices vary with the exact pickup and delivery addresses, the vehicle, the date and truck supply that week.
How far ahead should snowbirds book car shipping?
HaulFare booking guidance is 4 to 6 weeks before a pickup in a peak-direction month, and published snowbird guides from auto transport companies suggest 3 to 6 weeks for an October or November pickup. Booking early does not lock a price, because the actual price is confirmed only once a carrier takes the load, but it gives the broker more time to find a truck already running your corridor. The snowbird booking calendar sets out the dates for both legs.
Can I use this data in an article or report?
Yes. The tables and the CSV are free to reuse under the Creative Commons Attribution 4.0 license. Credit "HaulFare Snowbird Car Shipping Price Report, 2026-27 season (October 2026 price edition)" and link to this page. Please describe the figures as model estimates, not prices paid. For a cut for one metro, email press@haulfare.com.